What the client said
"We wanted to develop a good customer journey, so that people receive the support they need and local businesses are effectively utilised to tackle sustainability."
Marjan Faber, Project Manager for the Chain Approach to Sustainability - Municipality Noardeast-Fryslân
Data-driven insights
How we assist municipalities with their data challenges
Municipalities face complex issues that intersect and are constantly evolving. Consider the allocation of resources, the prioritization of investments, or the monitoring of neighborhood developments. Current data makes it possible to make more precise decisions and respond flexibly to changes.
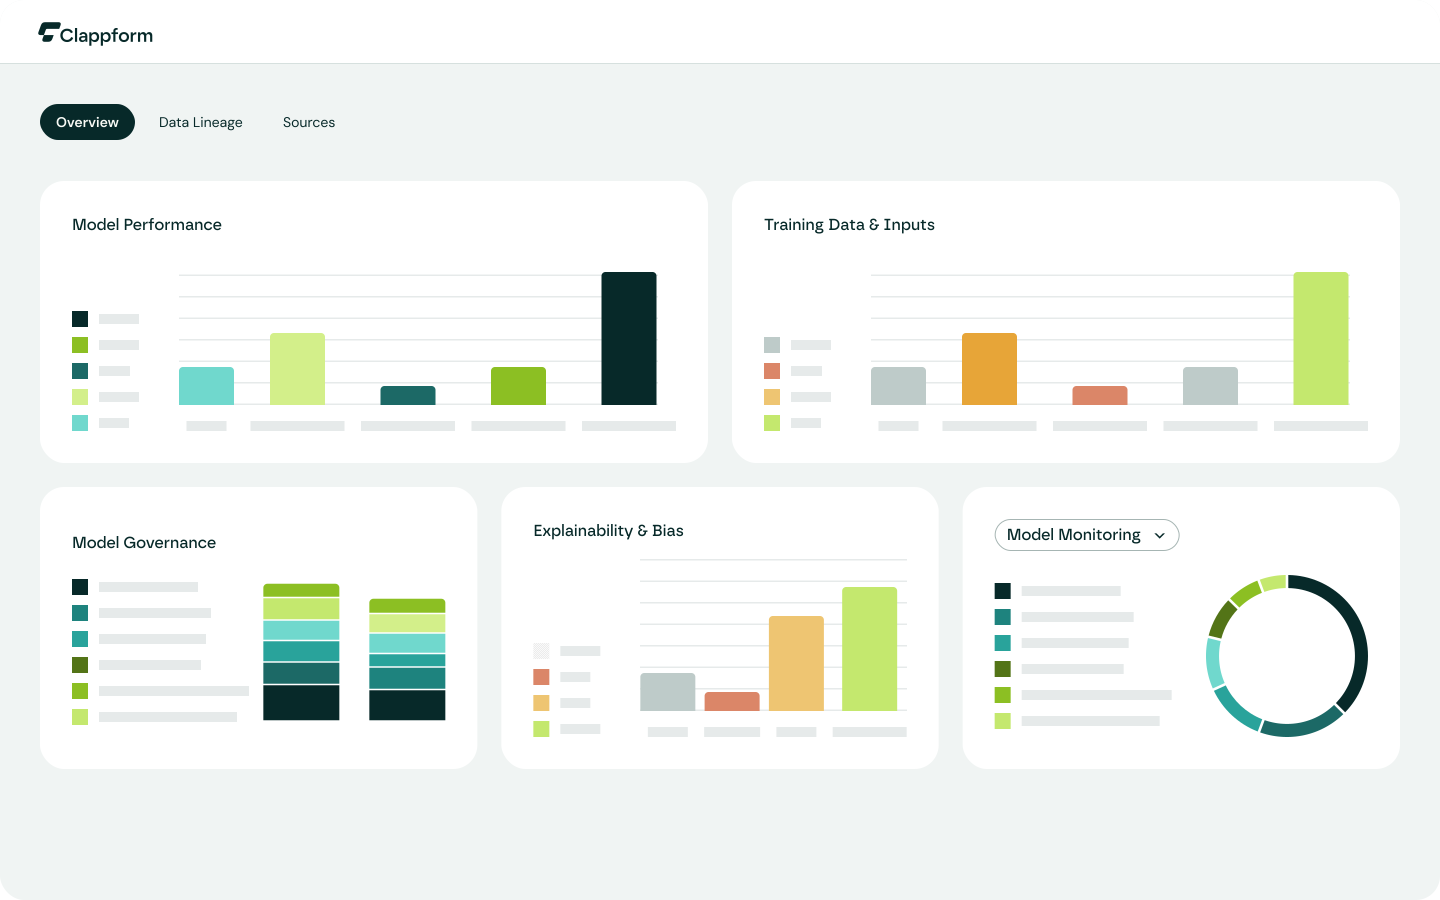
Clappform translates various data sources into clear, action-oriented insights. With real-time information and thematic dashboards, municipalities gain immediate visibility into progress, bottlenecks, and policy priorities.

Our promise
clappform.probines AI, data integration, and accessibility
Common Ground Standards
Clappform is based on the VNG's Common Ground principles, focusing on data reuse, a modular architecture, and open standards. This fosters efficient collaboration and accelerates digital innovation.
Data quality as a starting point
Clappform ensures data quality within a controlled environment. By working with direct integrations and data at the source, information remains up-to-date, reliable, and immediately actionable.
Low-code application
With a low-code front-end, we create tailored flexible solutions for our clients. Visualizing solutions on interactive maps? No problem.
Solutions
The power of Data Management
Housing Tracking System
The Housing Tracking System provides municipalities with up-to-date insight into the sustainability improvements of the housing stock: from insulation measures to energy performance. Through maps and dashboards, policymakers and project managers can track progress, select target audiences, plan measures, and justify results.
USPs:
Always up-to-date and reliable data
Modular and flexibly deployable
Visual dashboards and maps
Supports Policy and Implementation
Integratable with existing data sources
Figures:
With the Housing Tracking System, more than 1,200,000 homes have now been mapped in terms of the energy transition.

Integrated Neighbourhood Scan
The Integrated Neighbourhood Scan provides insight into the living environment at district, neighborhood, and address levels. From social and physical characteristics to safety and sustainability, all relevant themes are systematically and Data-driven mapped out. This enables policy officers to make informed decisions and work purposefully towards a healthy, safe, and future-proof living environment.
With visual dashboards, summary neighborhood overviews, and comparisons with other areas, the Integrated Neighbourhood Scan offers a powerful tool for an area-focused approach, fully aligned with the policy objectives and environmental vision of the municipality.
USPs:
Visual dashboards and maps
Supports area-oriented working and policy
Benchmarking with comparable areas
Figures:
The Housing Development Monitor is now being used in more than 50 municipalities.
Housing Development Monitor
The Housing Development Monitor provides municipalities with up-to-date insight into the progress of housing development tasks. From planned and permitted projects to completed homes, all phases are made transparent on maps and in clear dashboards. This enables policymakers and project managers to manage production, identify bottlenecks in a timely manner, and report to the board and region.
With reliable data and smart visualisations, the Housing Development Monitor supports the achievement of municipal, regional, and national housing construction targets.
USPs:
Visual dashboards and maps
Supports area-oriented working and policy
Benchmarking with comparable areas
Figures:
The Housing Development Monitor is now being used in more than 50 municipalities.